Large Conversation

Notebook Preparation
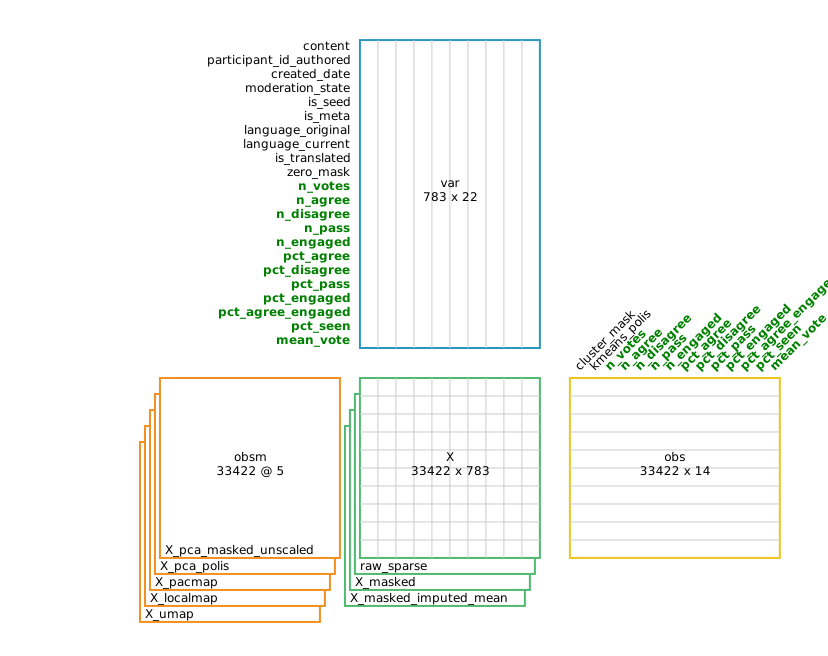
Screenshot of final results

For fastest processing
- Click
Edit > Notebook settings - Select
T4 GPUand save.
The runtime will restart, and the pacmap and localmap steps should run much quicker :)
import os

if os.environ.get("IS_GENERATING_DOCS", None):
    from itables import init_notebook_mode
    init_notebook_mode(all_interactive=True) # (1)!
- renders interactive tables for dataframes, which look really nice on the documentation website
Installation & Import
Loading Data
# Loads dataset of 33k german-speaking participants,
# run by Aufstehen political party in 2018
adata = val.datasets.aufstehen(translate_to="en")
Downloading bytes:           |  0.00B


Reconstructing (incomplete total...): |          |  0.00B /  0.00B


Fetching 7 files:   0%|          | 0/7 [00:00<?, ?it/s]
Loading ITables v2.9.1 from the init_notebook_mode cell...
(need help?)
|
| ⓘ | content | participant_id_authored | created_date | moderation_state | is_seed | is_meta | language_original | language_current | is_translated |
|---|---|---|---|---|---|---|---|---|---|
| comment-id | |||||||||
| 0 | I am afraid of war and conflict in the world. | 0 | 1536009294 | 1 | 1 | 0 | <NA> | en | True |
| 1 | I have existential fears. | 0 | 1536009306 | 1 | 1 | 0 | <NA> | en | True |
| 2 | The world is becoming more and more complicated and I feel overwhelmed by it. | 0 | 1536009361 | 1 | 1 | 0 | <NA> | en | True |
| 3 | I feel like I don't have my future in my own hands. My origins still define me. | 0 | 1536009375 | 1 | 1 | 0 | <NA> | en | True |
| 5 | The compatibility of family and work needs to be improved. Free daycare places should be normal and there should be enough available | 0 | 1536009393 | 1 | 1 | 0 | <NA> | en | True |
| 6 | I'm afraid of old age and retirement. | 0 | 1536009412 | 1 | 1 | 0 | <NA> | en | True |
| 7 | We now have to think about what will happen if certain jobs are taken over by robots and machines. | 0 | 1536009432 | 1 | 1 | 0 | <NA> | en | True |
| 8 | We need politicians with a connection to reality. | 0 | 1536009442 | 1 | 1 | 0 | <NA> | en | True |
| 10 | I actually feel very safe in Germany. | 0 | 1536009458 | 1 | 1 | 0 | <NA> | en | True |
| 11 | The shift to the right in society scares me. | 0 | 1536009466 | 1 | 1 | 0 | <NA> | en | True |
| (773 more rows not shown) | |||||||||
Running Vanilla Polis Pipeline
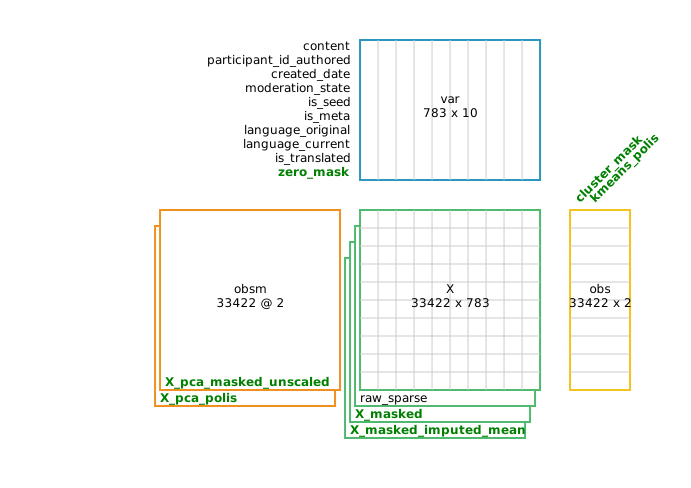
# Run the Polis steps and generate a "visual diff" for before and after (green = new)
with val.viz.schematic_diagram(diff_from=adata):
  # Takes ~1 minute
  val.tools.recipe_polis(adata)
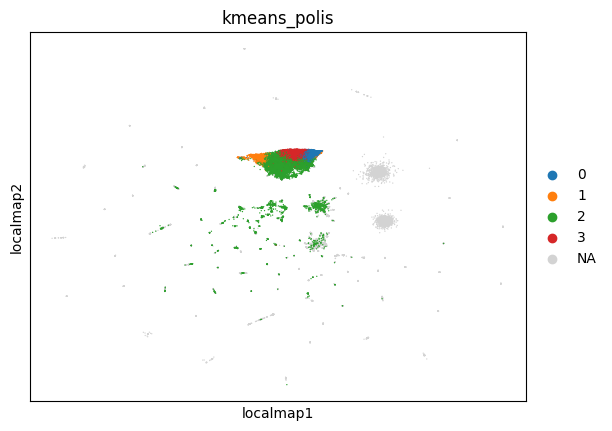
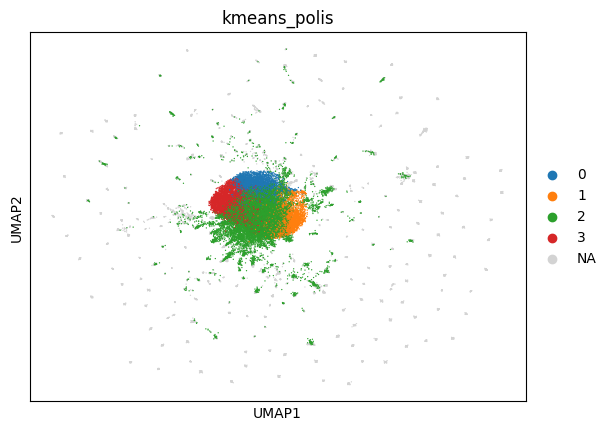
Running Additional Projections: PaCMAP, LocalMAP, UMAP
/home/runner/work/valency-anndata/valency-anndata/.venv/lib/python3.11/site-packages/umap/spectral.py:548: UserWarning: Spectral initialisation failed! The eigenvector solver
failed. This is likely due to too small an eigengap. Consider
adding some noise or jitter to your data.

Falling back to random initialisation!
  warn(
Animating 33k grouped participants
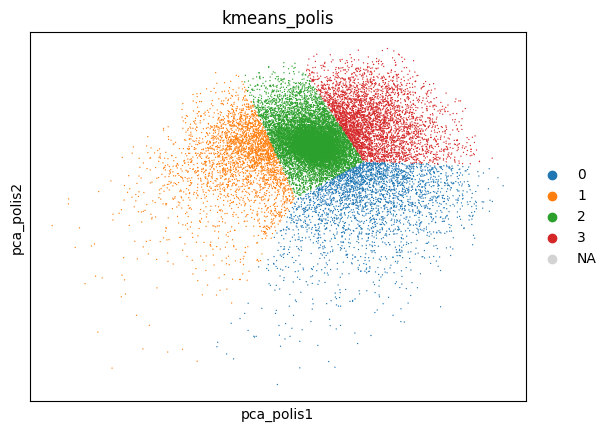
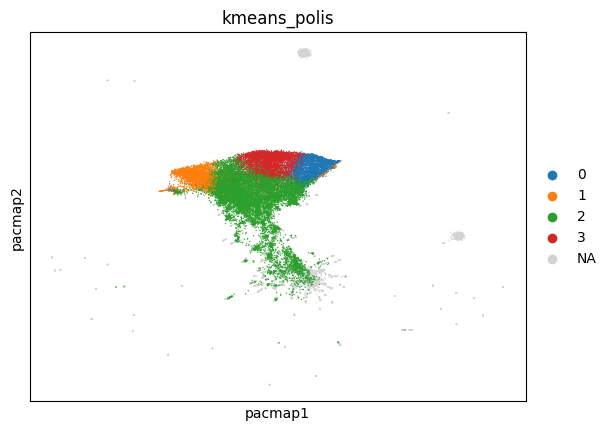
# Explore the differences between each projection based on the
# results of k-means clustering on the basic Polis PCA projections.
val.viz.jscatter(
    adata,
    use_reps=[
        "X_pca_polis",
        "X_pacmap",
        "X_localmap",
        "X_umap",
    ],
    color="kmeans_polis",
)
Coloring with data
# Calculate general vote metrics on all participants and statements.
with val.viz.schematic_diagram(diff_from=adata):
  val.preprocessing.calculate_qc_metrics(adata, inplace=True)